CINEMAS-plot
CINEMAS-plot is an integrated component to plot numerical data as graphs of several types, at par with a stand-alone plotting application.
CINEMAS-plot be envoked directly or through Analysis-workspace  , from the CASCADE workflows.
CINEMAS-plot has a table-and-graph layout, where user has control over the table as well as the graph. Data can be imported as a table, from file(s) in .dat or .csv format(as in latest version of CINEMAS). A number of mathematical functions can be operated on columns, to modify the table.
CINEMAS-plot tables
Tables in CINEMAS-plot are tailored for DFT utilities. And functions and operations are available to meet frequent requirements of a DFT user.
New tables can be created.
Data can be imported to these tables from files with DAT/CSV formats.
Both plain CSV and nested CSV(Fig. 79) are supported in CINEMAS-plot.
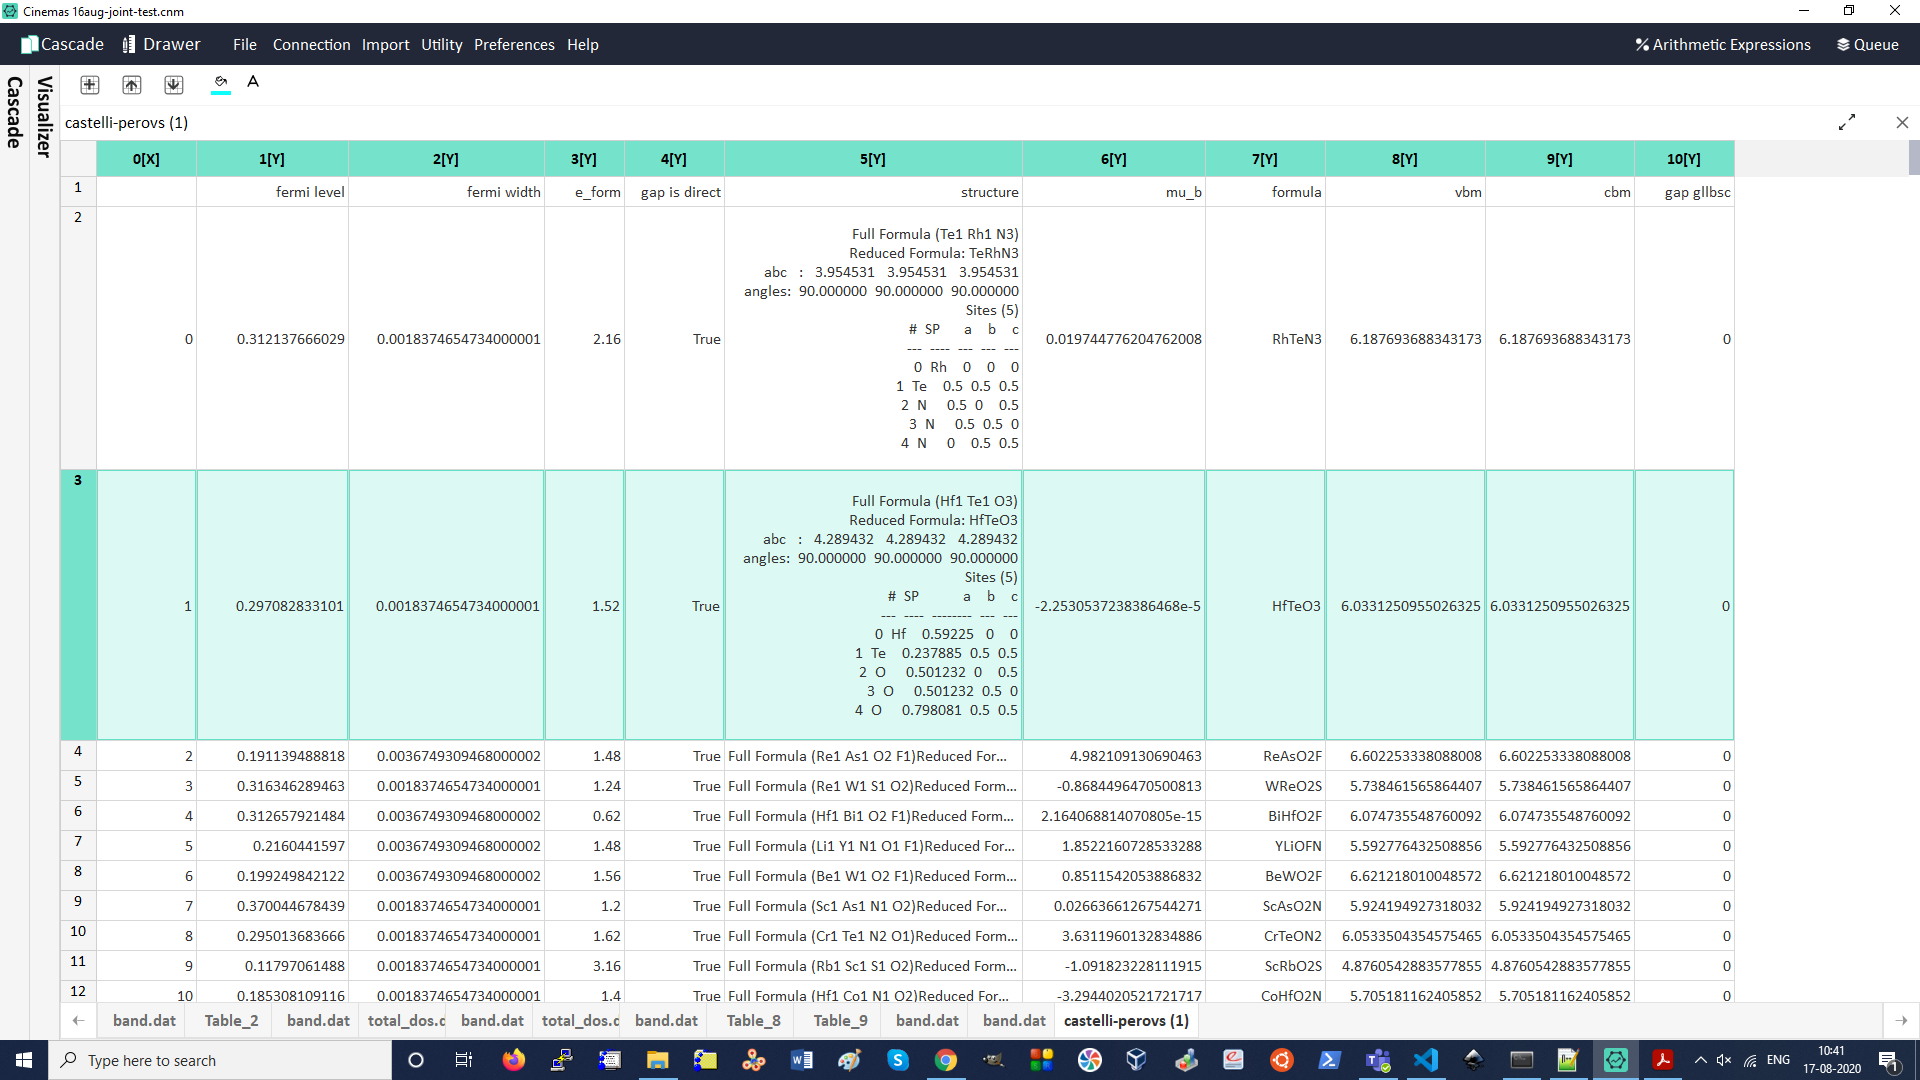
Fig. 79 CINEMAS-plot tables: Nested CSV loaded as a table, See column #5.
Data from CINEMAS-plot tables can be exported to CSV/DAT file formats.
Cells, rows, columns, or regions within a table can be highlighted for references or discussion purposes(Fig. 80, Fig. 81).
Change of color available for both, background as well as fonts.
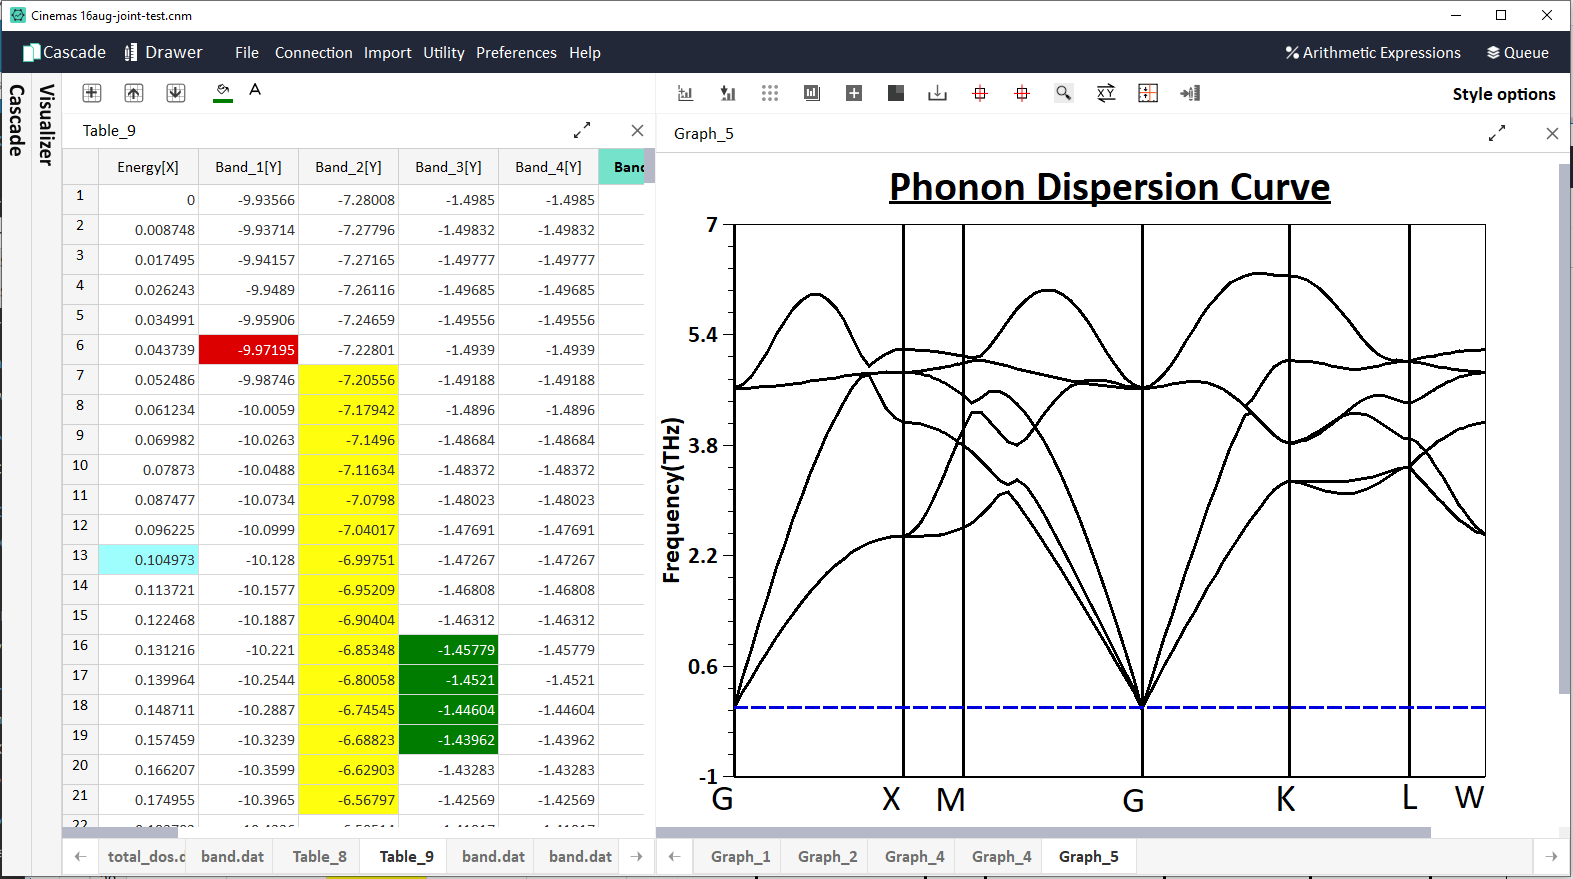
Fig. 80 CINEMAS-plot: appearance of table/graph window.
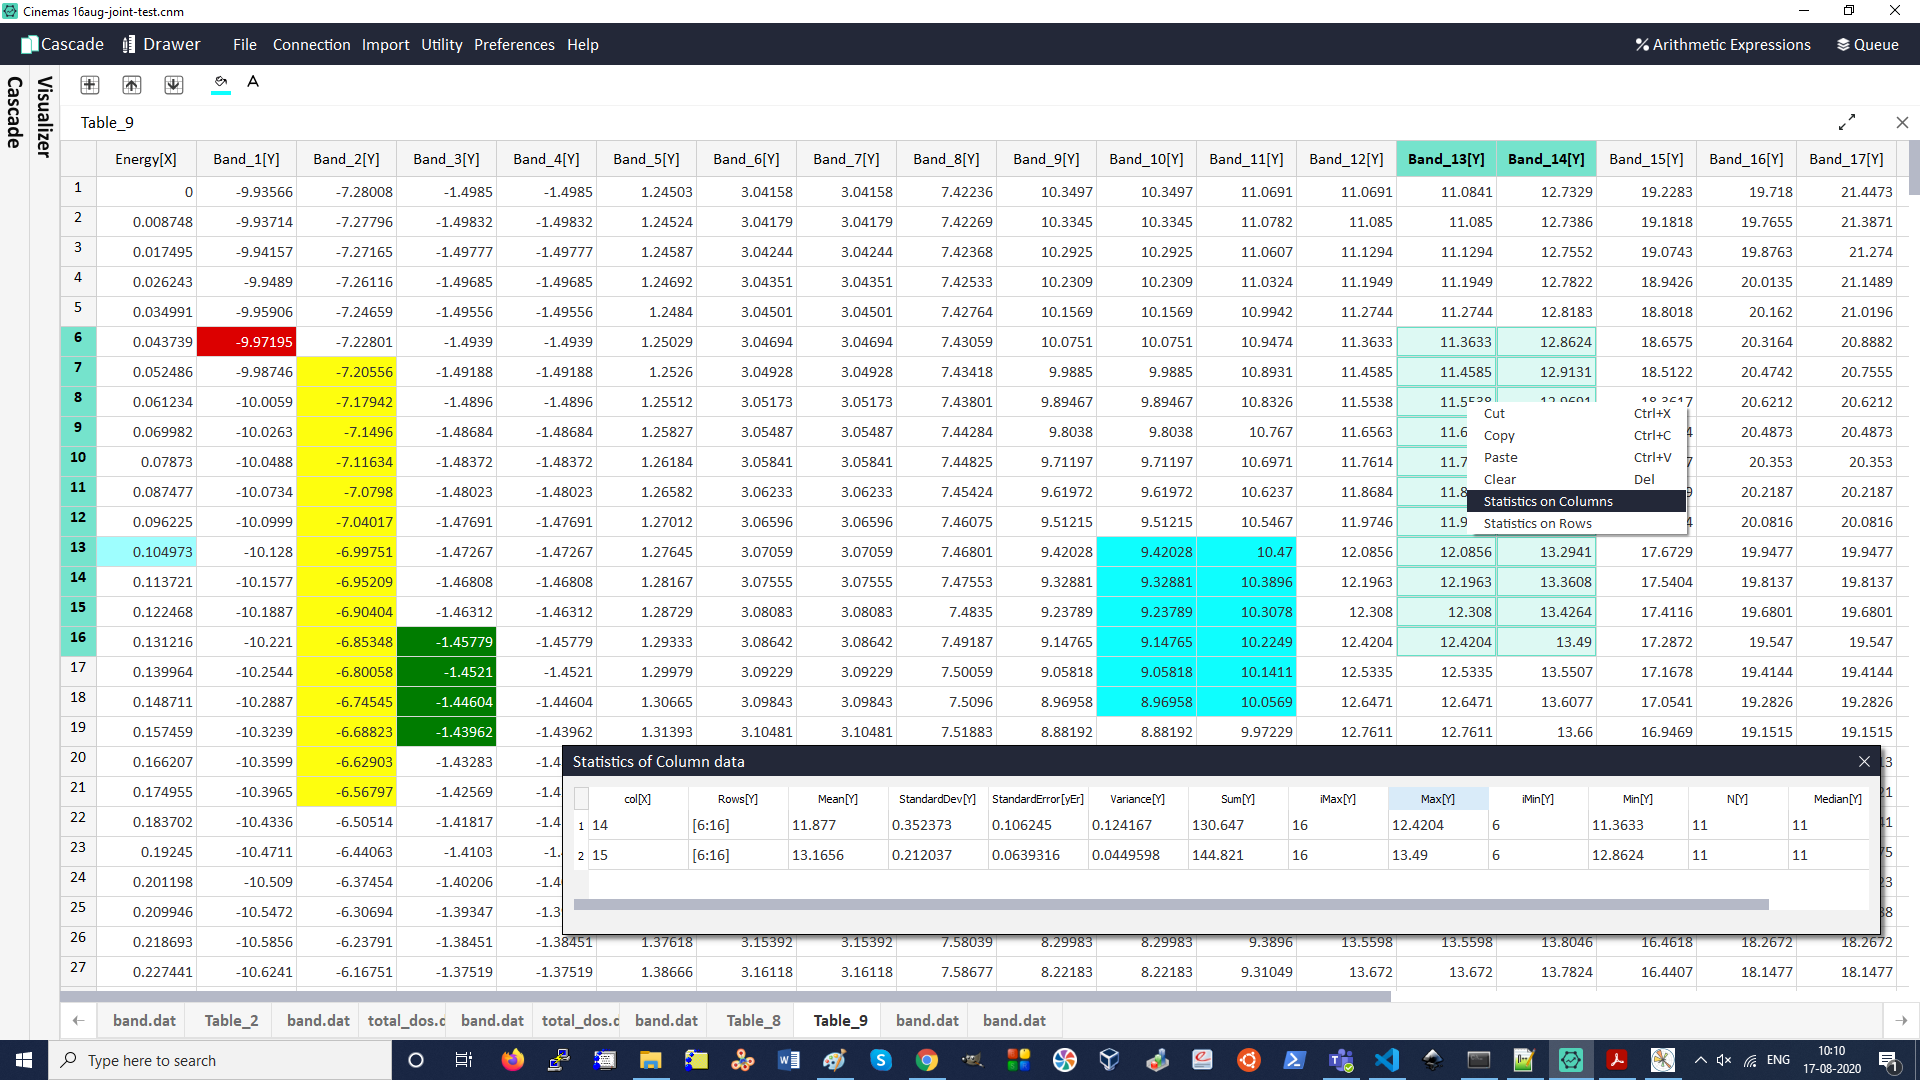
Fig. 81 CINEMAS-plot table: color highlighting and available statistical operations.
Several operations and functions are available for tables.
There are general but advantageous operations. See Fig. 82,
There are statistical operations available. See Fig. 81.
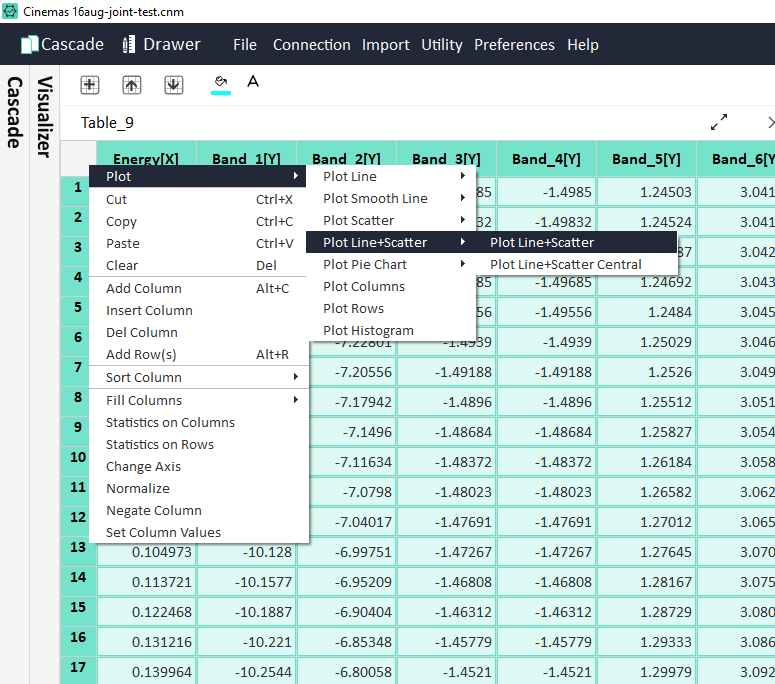
Fig. 82 CINEMAS-plot table: Available options for tables.
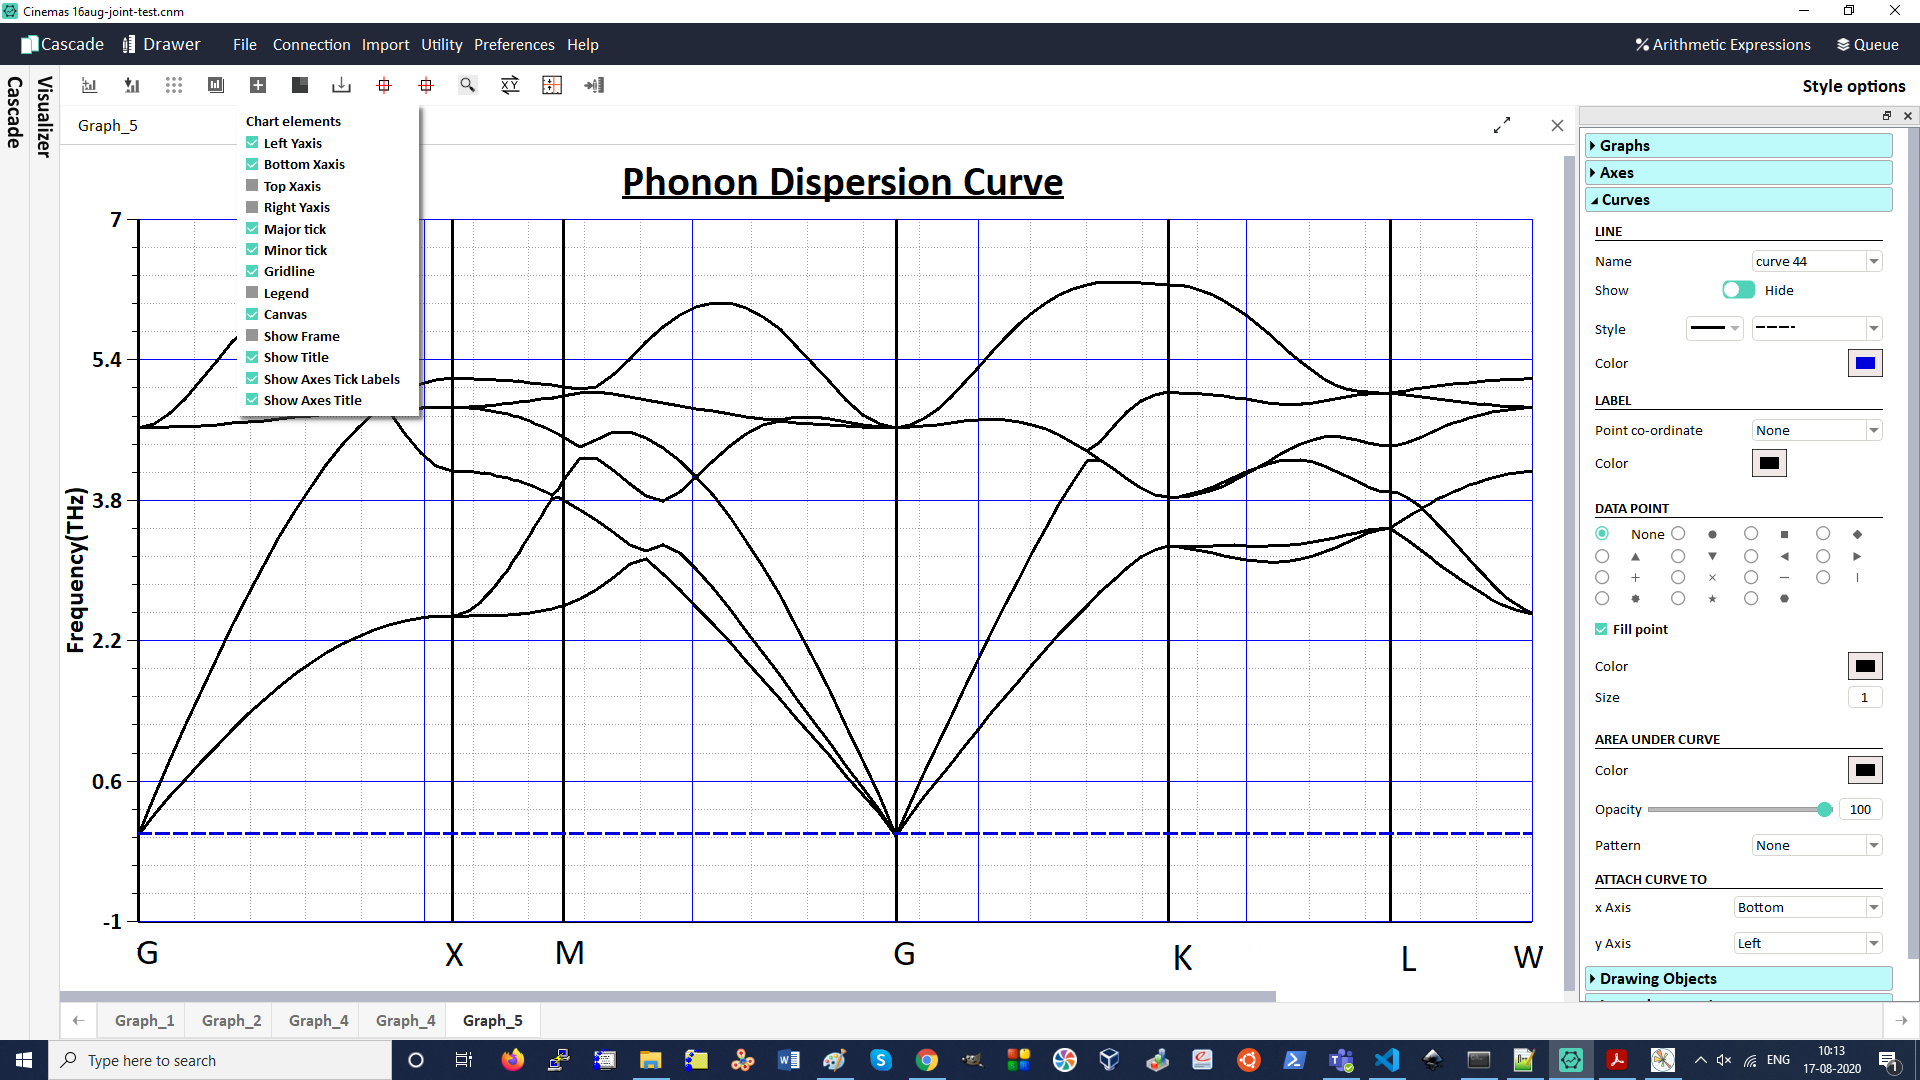
Fig. 83 CINEMAS-plot: Graph window in full-screen mode.
CINEMAS-plot graphs
Numeric data from the table(s) can be plotted as several types of graphs:
Line
Line + scatter
Scatter
Histogram
Pie chart
Bar plots(Row/Column)
Graphs can be exported to .jpg/.png format with scaling up-to 20X, and vector formats like .ps/.eps/.pdf.
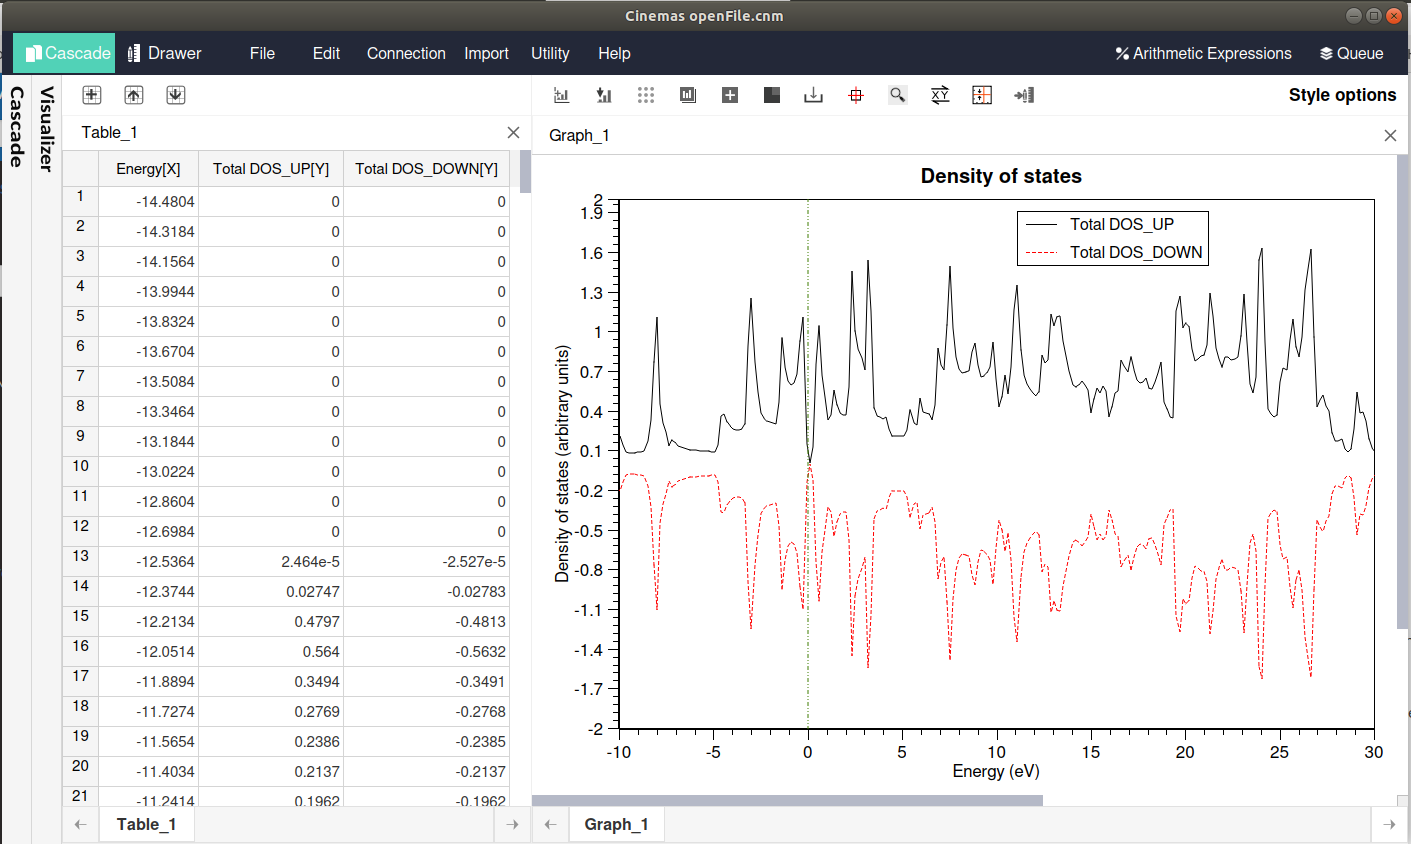
Fig. 84 CINEMAS-plot: appearance of table/graph window.
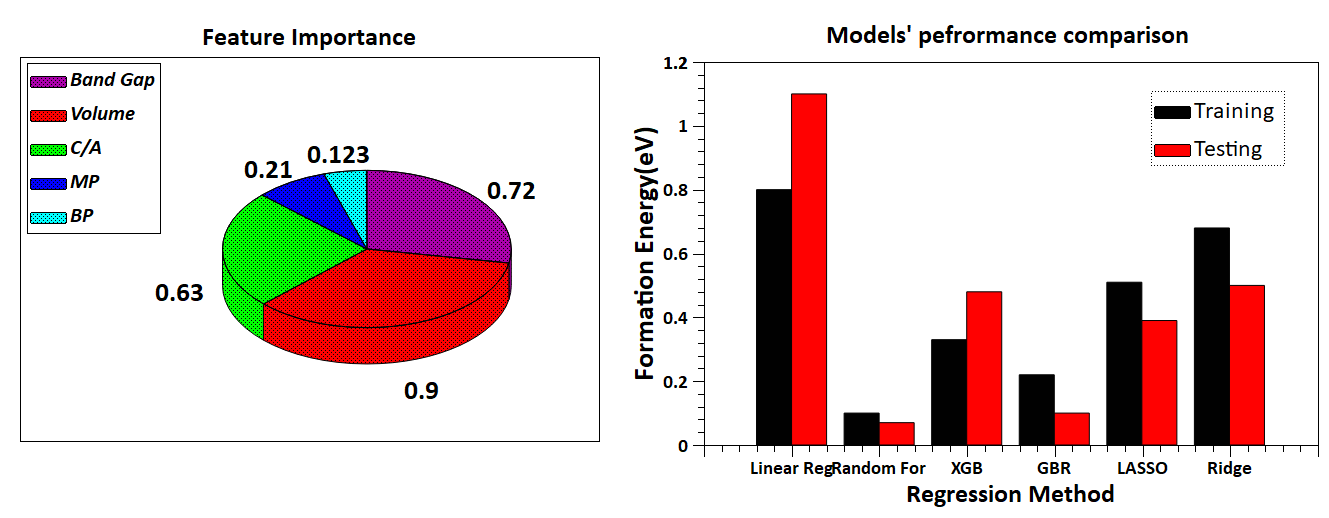
Fig. 85 A sample graph from data driven computations.